Leveraging modern technologies
Asset management is a programmatic means of overseeing reporting, and improving assets and equipment. It refers to the systems and services used to control and maintain these assets with the aim of optimising their utilisation, productive output, and increased lifespan while reducing operational costs.
With the increasing connectivity of various systems and networks in the current "Internet of Things" era, advanced analytics and AI are continually being incorporated into asset management or asset performance optimisation - it is in this arena in which our new platform Asseti has been steadily building a reputation for excellence.

Asseti has been filling a role that has become increasingly indispensable in the current asset management environment – that of gathering, processing, and analysing the massive amounts of data that allow these exciting, new, data rich processes to reach their full potential. This process sits aside traditional Enterprise Asset Management (EAM) solutions like Maximo, SAP EAM, Infor CloudSuite or UpKeep. EAMs are programmatic and constrictive in their capabilities, more concerned with compliance and documentation that expediting identification of issues or their rectification. Asseti is specifically designed to reveal issues at an aggregate network level, using information from, and feeding information back into, EAMs. These issues are compounded when considering linear assets, as EAMs are not optimised for their management, which can lead to even clunkier and slower asset management and asset network performance optimisation. After all, assets are varied, and come in many forms — gas pipelines, power and telecommunication lines, windmills, railroads — and each of these include a raft of their own specialised equipment required for normal operations. By taking advantage of increasingly sophisticated methods of handling large amounts of data, an effective strategy of breaking down large measurable assets into their component parts - sometimes called "chains" - has evolved. It identifies and considers the role of each discrete component within the operation of the larger asset, along with each of the components operate in conjunction with each other., and then back to how they affect each other in relation to the asset as a whole.
LINEAR AND POINT ASSETS
A linear asset is a measurable asset whose length plays a critical role in its maintenance. For example, assets like railroad or gas pipelines have characteristics associated with their length but may differ throughout their course. In the case of a railroad section, it may span many miles and cross multiple state or jurisdictional borders. The specifications of these sections will change as you travel along the length of it. The changes may include such things as speed limits, gradients, bank angles and crossings, that each change the characteristics of the asset. Each one of these factors will also change within the length of the asset, and each will require a different maintenance approach.
A point asset is a discrete entity, an asset whose length does not play a major role in the overall maintenance of the linear asset - for example, a pump, a railway switch, or a camera. When maintaining a point asset, you do not assign work to a particular length of the linear asset, but rather to its parts.
Once linear assets are broken out into chains or segments, each segment can be considered or managed as a point asset. But is this an effective method of classifying and managing linear assets? We would argue that linear assets have their own characteristics and even if your EAM is considering them as point assets that routine visual inspection plus a platform like Asseti can deliver real insight for the holistic network, to aid in performance optimisation.
Traditionally EAM systems have automatically treated all assets as point assets anyway, so why change all this now? It is because any work or maintenance on the principal, or linear, asset will often impact one or more of the point assets. To use the railroad maintenance example once more, individual repairs to seemingly insignificant elements of the network resulting from track inspection, or major asset repair such as track replacement, may have been the problem area initially identified ... but the results of that work or repair may have an unintended effect on other point assets within the same linear network. The need for a relational perspective arises because the traditional hierarchical methodology was often inaccurate or inefficient due to the need to break assets all the way down to smaller, seemingly unrelated, assets to maintain the functioning of the whole. This led to location specific monitoring of the linear asset failing due to the tracking systems being unable to represent that whole. More sophisticated methods of issue identification and relational causation are required to reveal that kind of connection (such as enabled by regular visual monitoring and intelligent data processing through our platform, of course!).
So how is it possible to capture the different specifications and requirements of each point asset, while relating it to the continued functionality of the linear asset? The concept of Dynamic Segmentation has evolved as a solution to this common problem. Dynamic Segmentation allows planners to divide an asset into logically related sections, or portions, without disrupting its continuity and flow.
A road is a good example of a common linear asset. The road spans 60 kilometres. For the first 20 km, speed markers of 80 kmph are set. For the rest of the road's length (40 km) the limit is raised to 110 kmph. At the same time, the same stretch of road has two lanes for kilometre 0 - 20, and three lanes for kilometres 20 - 60. These two properties, or attributes, are defined within the context of the linear asset itself. The linear asset is segmented virtually to allow you to analyse and work with it in a more efficient and logical way. Once these segments have all been identified and inputted into the dynamic system, pinpointing the problem area, and planning the work becomes easier for the algorithm.
LINEAR REFERENCING METHOD
Linear Referencing Method is a method of applying Dynamic Segmentation in linear asset management.
Linear referencing defines the location of each point along the length of the entire linear asset (e.g. a road). It marks distance measurements along the asset and assigns each to known points along the X, Y, and Z axes. X is the value given to the entire length of the linear asset from a known starting point. Y is the distance to the left or the right of the linear assets start point, while Z represents the distance, or height, above or below the same. These can also be labelled as 'measure', 'direction', and 'offset' values. This creates a graphical 3D view of the entire asset and can be used to identify and assign work locations. Using this it is then possible to define multiple linear referencing points for the asset.
The model can be demonstrated using a hypothetical underwater natural gas pipeline as an example.
During the construction and laying of our hypothetical pipeline, sensors and GPS units were attached and calibrated. The pipeline is then laid over and through several different physical environments such as sea and swamp, and at varying depths below sea level. A probe called a "pig" is then used during maintenance cycles. The pig is flushed along the length of the pipeline that is being inspected. It has its own onboard sensors, odometer, and GPS. The pig can then pinpoint the exact location and give details of any fault (such as a crack, or a leak) it may find along the pipeline's length. These details are then passed on to the appropriate team for repair. In this case, the location of the fault is measured by combining the absolute length (via odometer), direction and height (via GPS) coordinates as plotted on the X, Y, Z graph. In that way the intelligence is utilised to affect repairs. Above that, our intelligent platform can consume the data and infer nuanced connections between different sections that can reveal performance optimisation opportunities for asset managers.
This insight is combined with visual inspection and mapping by MA and appropriate sensor data feeds, to enable the build and management of a digital twin of the linear asset. Using Asseti, MA is able to deliver insights to improve asset uptime and reduce outages.
MEASURE AUSTRALIA
MA's platform Asseti is a consumer of intelligence with the computing power to digest massive volumes of data, serve it coherently and build a nuanced picture and projection of asset management networks. As such, MA is ideally suited to apply Linear Referencing Method and Dynamic Segmenting in the linear asset optimisation environment.
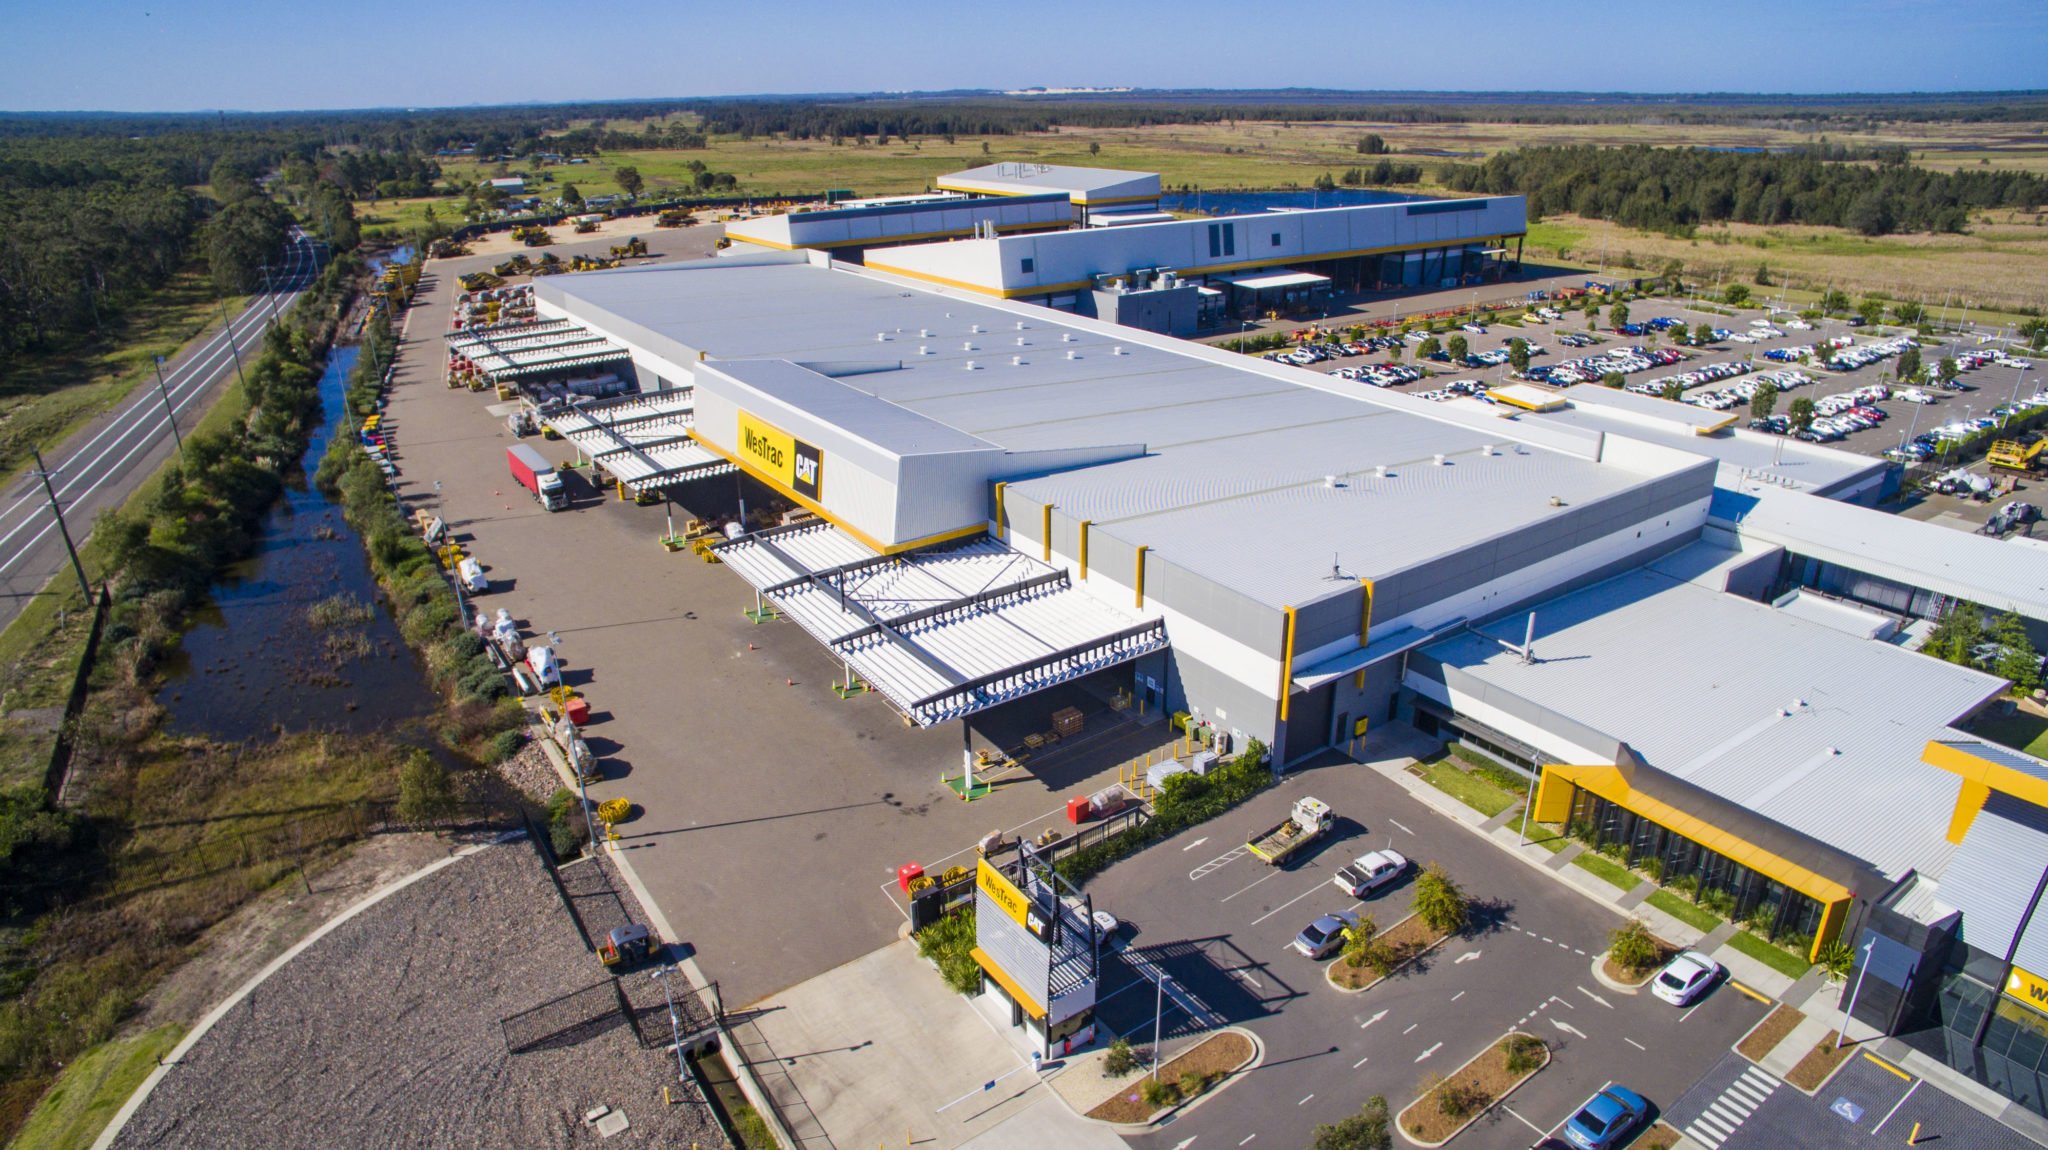
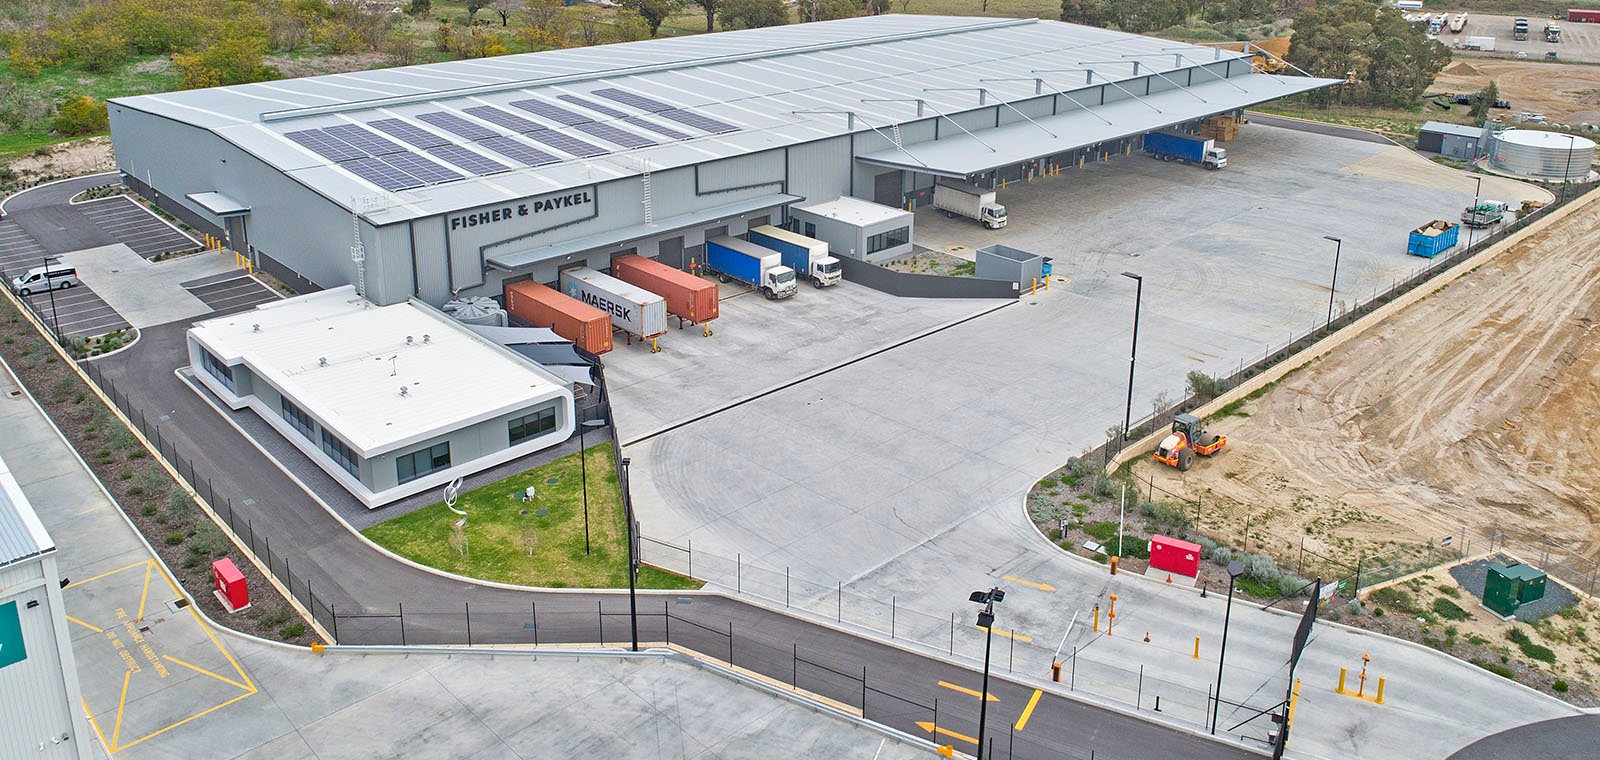
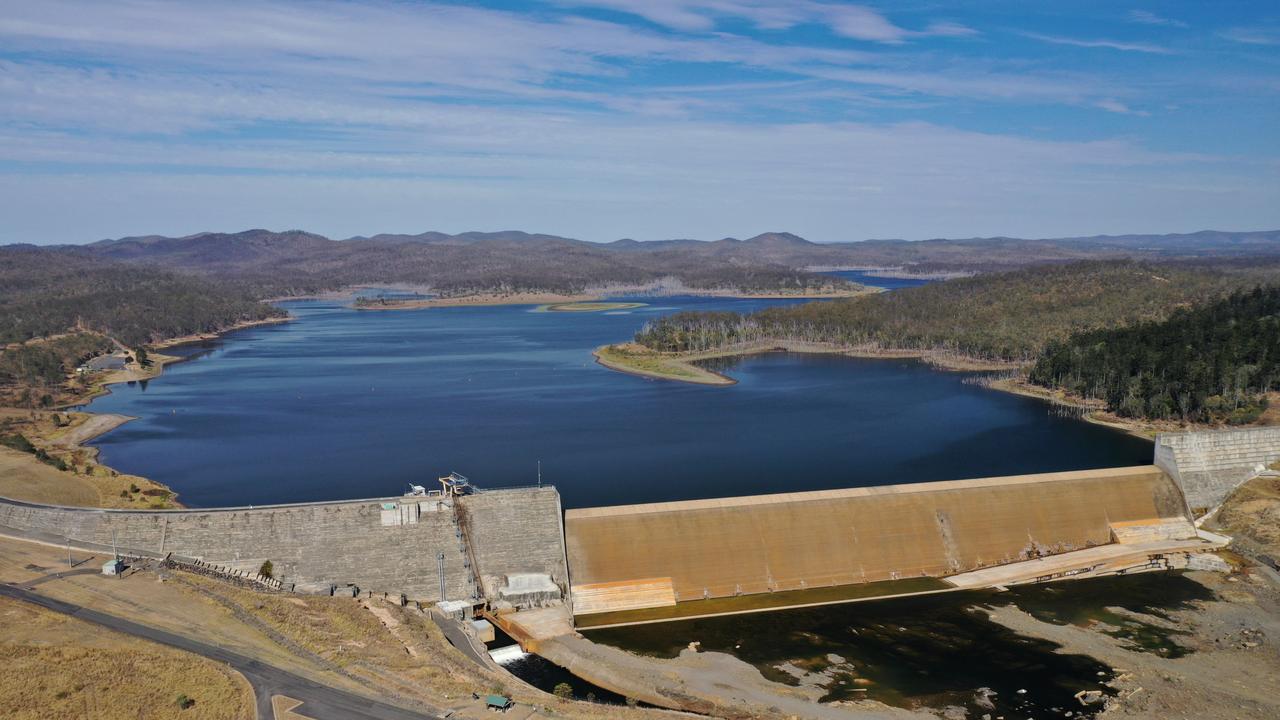
MA is experienced in the use of drones and remote capture technology. Both are becoming increasingly prominent in asset management. They are particularly useful in rural, remote, and difficult to access areas, and are well suited to the inspection of linear assets such as pipelines, power lines, windmill networks and railways. High definition imaging, and the ability to quickly, and easily, access areas traditionally difficult for manual inspection make the technology appealing, fast and cost effective. Drone inspection is the fastest and most affordable way to inspect assets that cover a large area or difficult terrain. It is far safer to manipulate a drone controller, than to hang out the door of a helicopter while manipulating a HD imager.
MA uses photogrammetry and LiDAR laser scanning to help create and build up a 3D geospatial picture. This is particularly valuable in the construction of linear asset models. Combining this with the data processing capabilities, analytical efficiency, quarterly cyclical captures, and user-friendly dashboard interface of Asseti has the potential to give any asset network management and performance optimisation operation an advantage.
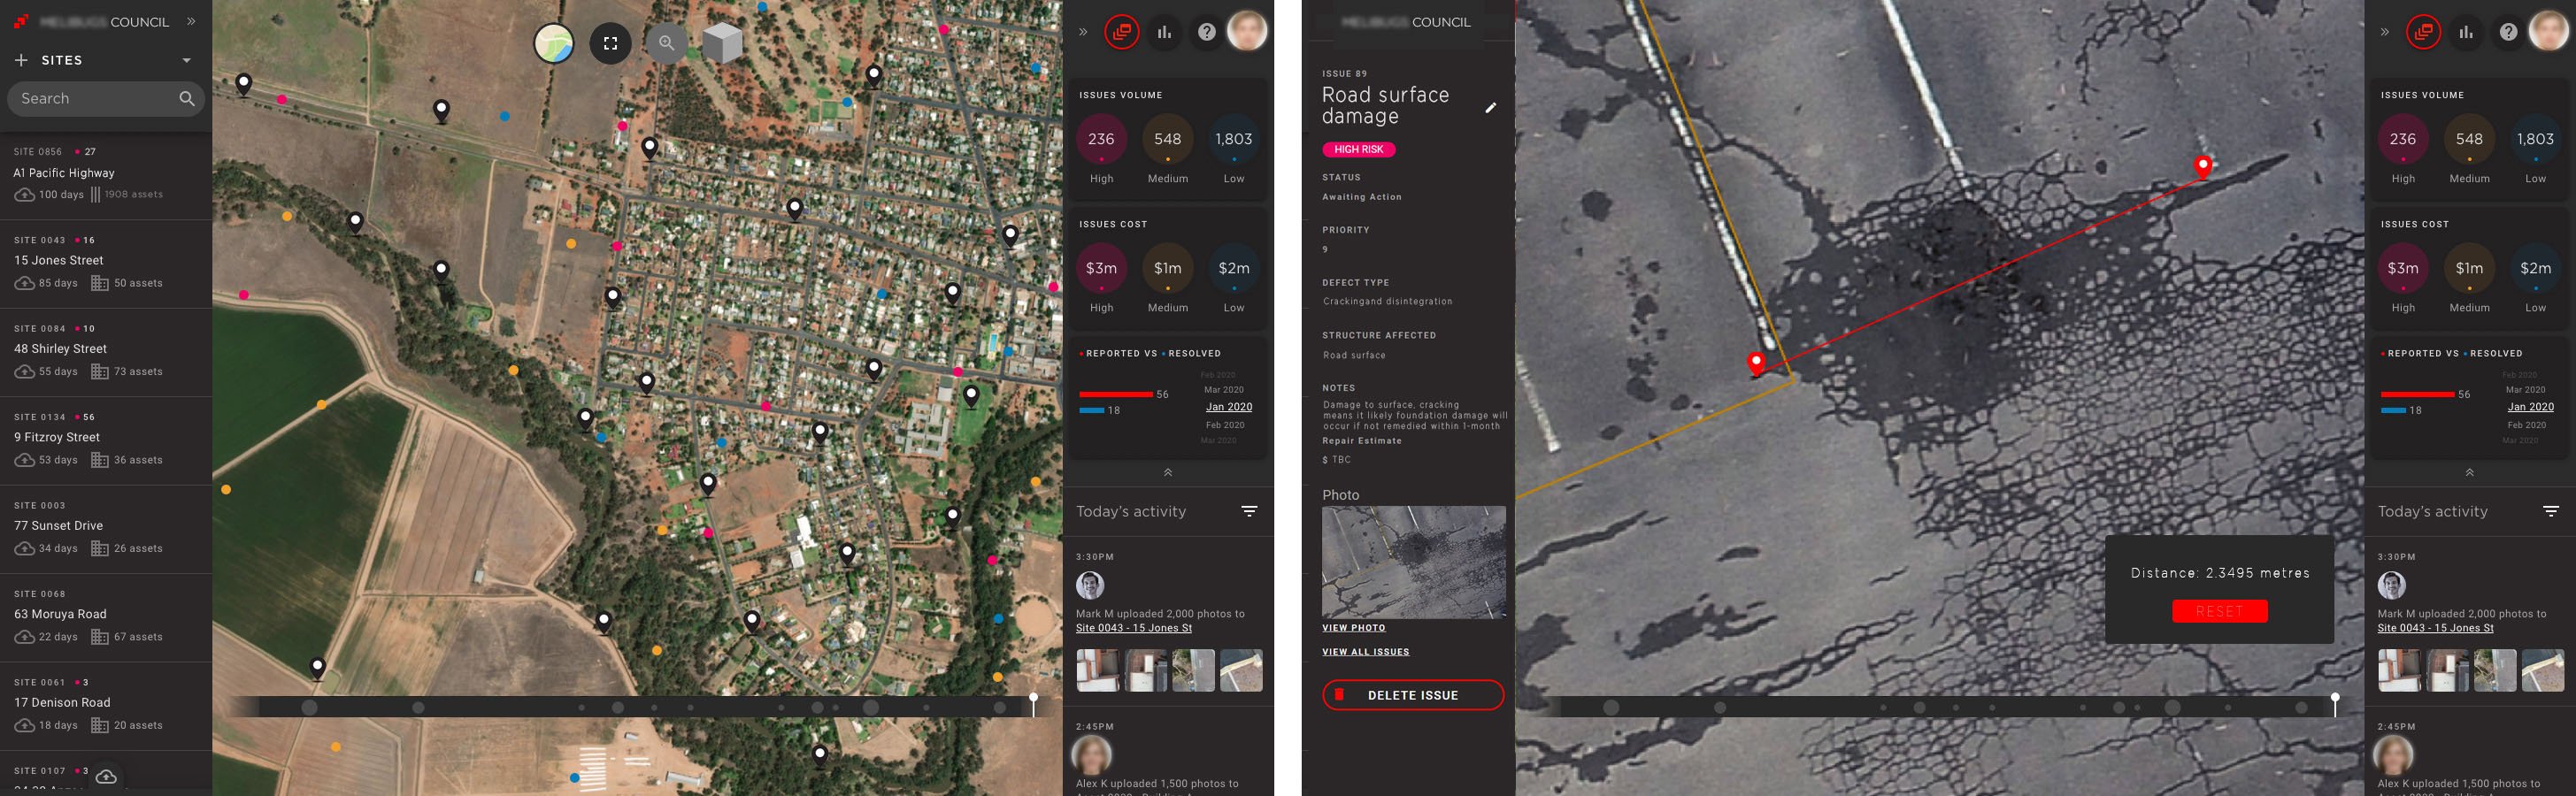
Caption for below: aerial imagery captured and processed by MA, using Asseti. A region was captured, issues identified, and works planned using tools such as measuring damages to better estimate repair materials and time requirements.